-
Some Background to my Vendor Research
If you are reading this, then I assume that you’ve looked at a couple of my Vendor Selection Matrixtm reports and are thinking … they look like magic quadrants or waves but they seem to be different… Well, they certainly are – in more ways than one !
I do this work with my business partner Research In Action and mine are written for marketing software buyers who need to automate one or more important marketing processes and are researching which vendors COULD provide the software their business will require for optimal functionality and strategy.
They’re likely to be calling the project something close to the process(es) being automated and improved, but there is no guarantee that the vendors will be using that terminology when describing their products.
I design my projects around the process name I think Marketers would use and survey businesses on their experience. Often, that collects a landscape of vendors using different technology labels but that is the reality.
All in all, there is a multitude of vendor report types out there. On one end of the spectrum, you have the Analyst Reports with industry analyst expertise and in-depth research. On the other end, we have Crowd-Sourced Reports in which rankings are driven by the quality and quantity of user reviews.
Analyst Reports
Pros: The “Tier One” industry analysts doing this work are experts in their field and seriously know their stuff. They sit through strategy and product presentations/demos and some even get feedback from referenced customers. Vendors must invest days of time and resources to provide the right information to the analyst. Of course, many also sign up as clients and engage with the analyst on an ongoing basis to optimize the relationship.
Spoiler Alert: In my time as Research Director at Forrester, I had an analyst in my team who consulted specifically on how to execute the process of Analyst Relations (it’s part of B2B Marketing after all) – including how to get yourself placed in an optimal position in a quadrant or wave analysis.
Cons: The Analyst Report is written for the research firm’s clients, usually large enterprises – which influences the list of vendors include, of course. These are smaller audiences than is often assumed. Usually, the readership of each report behind their paywall is perhaps in the hundreds – one vendor client told me that the latest two reports where his product was featured had 480 and just 58 views on the research website.
That can be a little depressing not only for the vendor but also for the analyst – all that work and so little attention! Of course, the brand power, and resulting product-marketing ego, of being in a “Magic Quadrant” or “Forrester Wave” means that some vendors buy reprint-licenses and offer a download of the report through their website. And they book the analyst to make speeches/webinars about the research – a little show business that compensates for the initial disappointment perhaps.
Crowd-Sourced Reports
Pros: It’s always helpful to seek out feedback from other users; peers who share the good, bad, and the ugly about a product. There are several such feedback websites now up and running for all types of software applications, including marketing.
Cons: Have you ever looked up your favourite restaurant on Yelp, noticed a few one-star reviews, and wondered how they could come to such contrasting conclusions? A single review (good or bad) shouldn’t dictate your software-buying decision, just like with any other product. Remember: User opinions have varying levels of actual marketing automation understanding – just because someone writes a review does not make them an expert in the field.
Additionally, report rankings are driven by the quality and quantity of user reviews. If a company has a few hundred reviews with a high rating average, and another has a few thousand reviews with above-average ratings, it is likely the latter will position better in the report due to the sheer number of reviews. This is a huge advantage for larger vendors that have been on the market for a long time, and it’s likely they have review incentive programs to boost their ranking.
Research In Action Reports Have Both Perspectives
The methodology at Research In Action is that we first survey 1,500 practitioners about THEIR view of automating the process(es) in questions. And then we ask them to name one or two vendors they associate with the project and give us feedback on the vendor’s product, service, value-for-money, and ability to innovate. The vendors who score highly enough in the survey get into the Vendor Selection Matrixtm report in the first place (usually 15 to 20 vendors).
Then, that curated market feedback is seasoned with a touch of industry analyst’s (that’s me) expertise to provide a more well-rounded recipe for successful vendor selection. In fact, much more than the quadrant or wave reports, these reports are embellished with several pages of trends insights that inform both buyers and vendors alike about what is most important when investing in the upcoming project.
Research In Action Reports are Widely Read
When Research In Action publishes its reports, they are made available to several communities:
- Survey respondents. The 1,500 marketing software decision-makers who answered the survey questions are provided with the full report as feedback
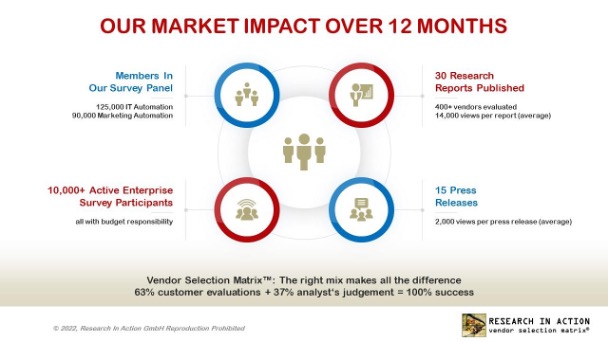
- Survey panel. Research In Action maintains an active survey panel on a global basis with contact details and topics of interest: a current total of 125,000 IT Automation decision-makers and 90,000 Marketing Automation decision-makers. These panel members are informed of the report and can download it if desired
- Website visitors. Any viewers of the Research In Action website sees a “public version” without the exact scores and matrix placements of each vendor (to save their embarrassment) but with all insights and the most important facts on each vendor.
- Vendor reprints. Research In Action does also license reprints, where a vendor can distribute a copy of the report, with their detailed profile, to interested parties.
On average, each report gets tens of thousands of clicks on our website. Personally, I am quite proud that so many people now get to see my work. And, when I am booked to do speeches and webinars, I know they are booking me personally, not the brand power.
Our work really does fill that gap between an industry analyst report focused on large enterprise needs, and the “trip-advisor” type of review websites. They also reach and assist a broader community of software buyers. Lastly, the community reading the reports is probably a whole order of magnitude higher than the audience able to access the “Tier One” research reports. Here is our latest Market Impact statistics chart.
Always keeping you informed! Peter
-
Employee Churn: Challenge or Opportunity?
We are about to publish my next B2B Marketing Propolis Premium Report, titled The Great Resignation: Dealing with Employee Churn and New Expectations.
I enjoyed working with Jarmila Yu, Propolis Hive expert for Teams/Resourcing/D&I while the interviews were with marketing executives across several B2B sectors.
Here is the opening chapter; “The Great Resignation forces marketers back to management basics”.
“Yet another challenge for marketers. They are already dealing with the shift to more digital marketing channels; to more customer-centric and personalised content marketing; and towards using new technologies such as predictive analytics, advertising retargeting and account-profiling. Now, as if that wasn’t enough, they are also facing widespread changes in the working conditions across their businesses. They are not only seeing significant personnel churn in their marketing team, but also dealing with radical changes in the expectations of their teams when it comes to the working environment.
This is not a trend unique to the marketing department. Business employees across the board are quitting their jobs at a rate not seen in over a decade. The chief UK economist at Deutsche Bank in London reports that analysis of official data suggests people are resigning at the highest rate since 2009, with “historically elevated levels of workers leaving the labour market entirely”.
The data shows that a so-called ‘Great Resignation’ wave is happening around the world in the wake of the pandemic. In the US, where the government produces official data on the so-called ‘quit rate,’ the record 4.5 million people that resigned in November 2021 was followed by another 4.3 million resignations in December.
Employers across the UK complain of struggling to both hang on to and recruit staff. Redundancies in the UK are at their lowest level since the mid-1990s, while the level of open vacancies is the highest on record. The employees are leaving for a variety of reasons:
- Some are frustrated. Employees want to change their working environment because they are no longer satisfied with their current situation. Some have experienced inconsiderate leaders, unrealistic expectations of work performance, and/or a lack of career advancement. Those who saw colleagues being furloughed often had to shoulder greater workloads and work more time to help keep operations afloat.
- Others are just tired. Burnout and stress, family-care demands, and personal life-reflection after the Covid-19 pandemic are prompting many employees to reconsider their overall work-life balance objectives.
- Seizing the opportunity to move on. Many business professionals are now reconsidering where they want to live, let alone where they want to work. There is an increasing numbers of job opportunities that can be fulfilled remotely without ‘The Great Commute’ to deal with anymore.
The marketing discipline is one of many feeling the impact of this trend, which LinkedIn, the professional networking and career development platform, calls ‘The Great Reshuffle.’ The company reports a 31% growth of members with marketing careers changing jobs in 2021 compared to the previous year. That translates to a whopping 618,000 marketing job changes in 2021. And this at the same time as many firms are also ramping up their marketing departments. The past year saw a mind-blowing 374% growth in marketing jobs, with 1.3 million marketing jobs posted to LinkedIn.
So, is the ‘Great Reshuffle’ or ‘Great Resignation’ an opportunity or a challenge for marketers? Perhaps it’s a bit of both, offering an opportunity to re-build the business in a better manner, and ensuring that people are better placed in more rewarding and engaging careers.
For years, most B2B marketing organisations have been working with a ‘do more with less’ approach, with burnout and a lack of mental wellbeing all around. So, was the great resignation about to happen anyway and just accelerated by the pandemic?
The number of open marketing roles is at a seemingly all-time high in 2022. Is this because there is an overall increased need for marketers, or is it that there is a greater recognition for the role marketing plays in supporting business? Alternatively, is it a case of ‘where have all the marketing people gone and we need to replace them’?
The focus for this Propolis report is to answer some of those questions by examining and documenting how The Great Resignation has affected B2B marketing. We have held long interviews with several senior B2B marketers for deep insight into the topic. Hopefully, their comments will provide actionable advice for other marketers facing similar challenges. As you will see, these executives dropped a series of advisory nuggets in our conversations, so they will take the main stage throughout the report. Both Jarmila Yu and I have worked (and continue to work) with many clients on these issues, and so those experiences also feed into the report.”
The report will publish to B2B Marketing Propolis clients next month and a shortened version to the non-premium members later in the year. Contact me if you would like to get more details.
Always keeping you informed! Peter