-
Propensity to Switch Vendors
This year, I have collected several new Recommendation Index (RI) values from the Vendor Selection MatrixTM reports we have published. I see the RI as a significant leading indicator of long-term customer satisfaction but also, more importantly, of the propensity to switch indicated by customers. It is for that reason that we have included the points earned through the RI score in our Strategy axis on the matrix and give it a significant 25% weighting.
In our surveys, we actually ask about two items directly related to customer retention: the current satisfaction, and the “would you recommend this vendor?” question. Customer satisfaction is defined as a measurement that determines how happy customers are right now with the solution being evaluated and flows into the Execution axis of the matrix. The RI (the simple percentage of respondents who answer “yes”) encapsulates a longer- term, more strategic element of customer satisfaction – essentially it is a measurement of customer loyalty.
Vendors. I think that any RI 95% or over is satisfactory but an RI twixt 90 and 94% should raise some alarm signals about your customers’ emerging propensity to switch, while below 90% is already a state of alarm.
Buyers. You should interpret the numbers in a similar manner.
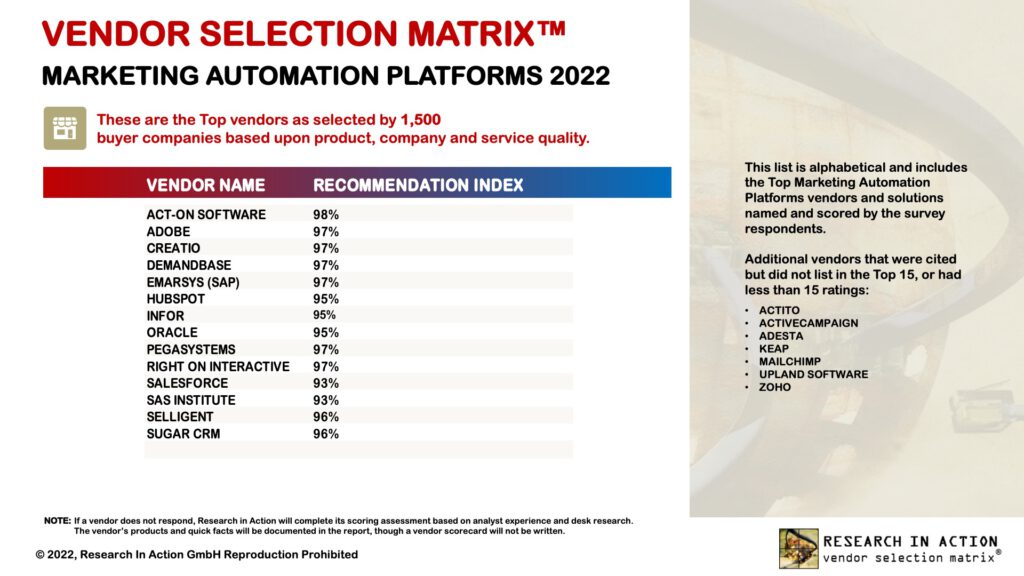
The data below shows that the vendors listed in our Marketing Automation Platforms (MAP) landscape include several that should feel threatened by a propensity to switch. Our survey also showed that 49% of the respondents were planning to replace their MAP with something more suitable while another 24% said that was under consideration – always a moment of truth for a supplier if your client is not really satisfied with their overall experience. And remember, these are the 15 or so vendors with the top scores – there are many others with lower numbers.
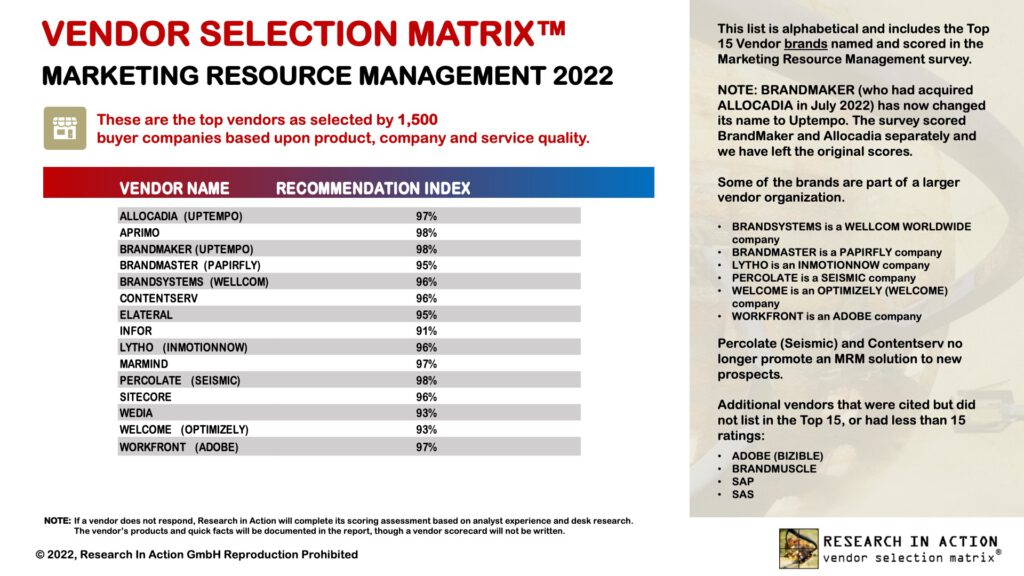
The next survey in 2022 was around Marketing Resource Management (MRM). Again, there are some vendors that should feel threatened by a propensity to switch.
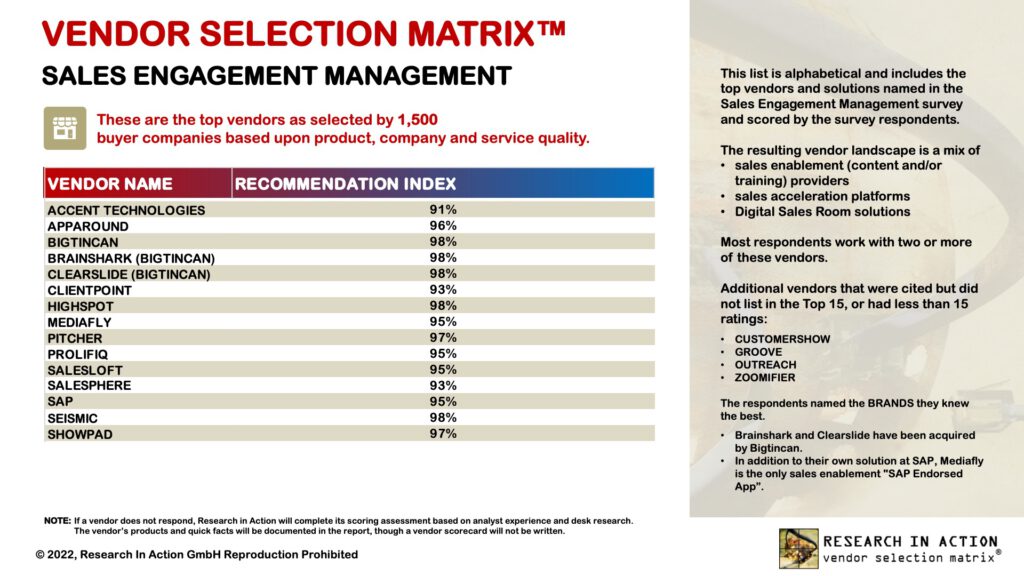
We have also published our report on the top Sales Engagement Management (SEM) vendors as rated by our global survey of 1,500 practitioners. There is already a lot of churn in this market as businesses race to replace their older SEM platforms with a more capable and holistic solutions for more digital selling and marketing. However, there were not that many vendors at 94% or below.
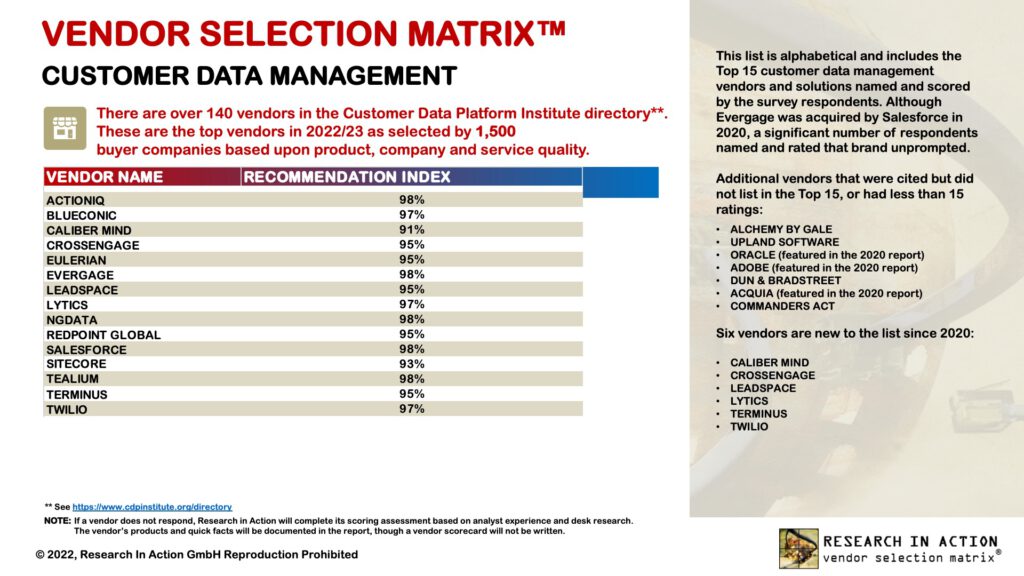
This month we published our report on Customer Data Management. The table shows an impressive scoring of all Recommendation Index values in the high 90s with just two below the 95% number that I would set as an alert.
Overall, the numbers are good for these leading vendors. We’ll see how this analysis progresses in the 2023 surveys we have planned.
Always keeping you informed! Peter